

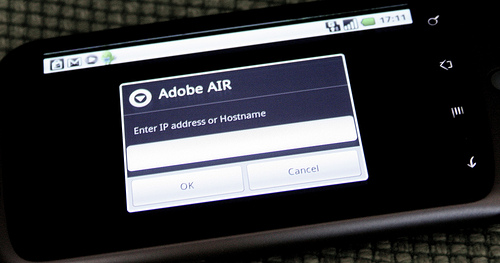
At first, it seemed like no matter what I did I’d just get the Enter IP Address or Hostname requester in my AIR app. So, to get rid of this dreaded requester once and for all follow my handy debugging AIR Android checklist!
If you’re new to Air for Android I’d recommend checking Lee Brimelow’s getting started tutorials here and here, and a couple of extra tips here on my AIR Android getting started report.
It is currently a little fiddly to get debugging, but as Air for Android is still in beta, this will hopefully become more seamless in future. But in the current build, here’s a list of things to check:
- Check that your phone has debugging enabled in Settings-> Application Settings -> Development -> USB Debugging
- Make sure that USB storage on the phone is turned on. (These two settings are required to publish your apps onto the phone)
- Make sure both your computer and your device are connected to the same wi-fi network. Sounds obvious I know but sometimes my phone disconnects from the wi-fi.
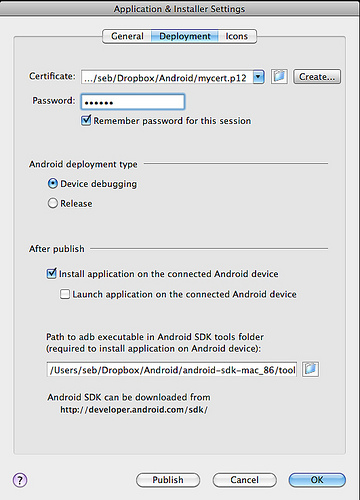
- Within the Flash CS5 AIR Android Settings in the Deployment tab check the Device Debugging radio button.
- In the same settings, check Install Application on the connected Android device and uncheck Launch Application on the connected Android device.
- Enable INTERNET_PERMISSIONS in your app by adding the following to your app’s xml config file. This should be in the same folder and have the same name as your fla file, but with the suffix -app.xml. Open it in your text editor of choice and add the following XML :
<![CDATA[ ]]>Make sure you add this to the top of the XML, not the bottom! I put it between the <copyright> and the <initialWindow> definitions:
...


                <![CDATA[  ]]>


        MyApp.swf
...
If you put it under the <initialWindow> definitions, the AIR Android extension seems to wipe it! It took me a while to work this one out, I expect they’ll fix it in the final build. I’ve also suggested that they set this permission by default if you’re publishing a debug build, it’d kinda make sense to me. 🙂
- Now you’re ready to publish the file, so hit Publish in the AIR Android Settings window. Your app will compile and get copied over to your device. But it won’t automatically run.
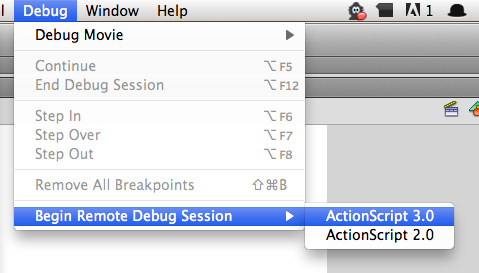
- Start remote debugging in Flash CS5: select the Debug -> Begin remote debug session -> Actionscript 3.0 menu item.
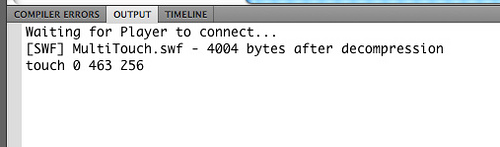
- And now run your app. With any luck, you should see the name of your swf in the debug output window.
You may still get the Enter IP Address or Hostname dialogue box but I must admit I only ever saw this if I didn’t set up the other options correctly. But if you do see it try typing the local IP address of your computer first, then the global one.
So! There you have it. Let me know how you get along and if there’s anything I missed.
23 replies on “How to debug AIR for Android”
adb logcat is another quick way to debug on a physical Android device. trace() output will appear during execution when connected via USB.
That sounds interesting, I’ve not seen mention of this before. Is it easy to set up? Documentation? Seems silly to debug over wi-fi if you’re connected via USB!
adb logcat is basically a dump via USB into terminal of what’s happening on your connected device (haven’t tried Android emulator but I suppose it might work there also) … it’s loaded with a lot of crap, but I you can search through the window for custom traces … logcat is one simple tool native Android devs use. I bet there’s a simple way to launch a terminal window that only displays relevant trace via logcat … I just haven’t invested the time to look into the unix piping for it.
Debugging AIR apps on Android device with Flash Builder:
//renaun.com/blog/2010/06/debug-air-apps-on-android-with-flash-builder-4/
Like Scott’s mentioned adb and logcat post:
//renaun.com/blog/2010/07/air-on-android-trace-with-logcat/
Videos in both posts show how it works.
Cool, thanks Renaun, I heard that someone had blogged about a FlashBuilder set-up but I didn’t realise it was you. Cool!
If you have something like trace( ‘~ ‘ + myVar ); in your source …
You can use:
adb -d logcat | grep ‘~’
to strip out all the extraneous adb logcat info and watch your tracing (assuming no ~’s appear elsewhere, make it unique).
I’m sure you could build a little desktop AIR app that managed all this better too.
Renaun. Thanks for posting. I’ll repost on my blog.
[…] Also, seb.ly got permission to post about debugging using the new Remote Debugging feature found in Flash CS5 which can be utilized for AIR fo…. […]
My latest version of the flash extension seems to overwrite the app descriptor xml file whatever happens and however high I put the android tags in the file. I don’t know if there’s an easy workaround?
Hi Ben,
Write the file at least once using the publish settings and then add the descriptor for Android permissions. If it’s wiping over your edits after the first publish event, then you’ve encountered a reportable bug.
thanks,
Mark
Hi Mark, I reported it in the forums, I think they said they were going to put it forward as a bug report. I’ll look into it again and see if it’s still happening.
Hey,
did someone actually manage to debug an AIR application when USB connected?
I managed to debug over wifi (here is my tutorial in french for those interested //www.flex-tutorial.fr/2010/08/05/air-android-debug-sur-mobile-froyo-emulateur-avec-flash-builder-4/) but when it comes to the emulator, i just don’t know how to get my machine’s IP, seen from the device. Cause i would need to use the debugger, not just the trace instructions but breakpoints and watch expressions.
If you have any tip or something 🙂
Thanks
Fabien
[…] Debugging with AIR for Android […]
Man, I’m having a though time w/ Flash CS5 and AIR for Android. I’ve done all the steps but still getting a the ip prompt and it says my ip is not valid.
[…] How to debug AIR for Android (Seb Lee-Delisle) //sebleedelisle.com/2010/08/debug-air-android/ […]
[…] running on device (Debug AIR apps on Android with Flash Builder 4, another in french and Flash), I have decided to attach some of my own findings and practices to build, deploy and debug […]
Worked once, but I’m not even getting the apk transferred anymore…
Hmm, had to stop & start USB Debugging for publishing to transfer to the device. Now the app installs on Flash publish, but still won’t connect to the debugger.
Is there perhaps some other settings that’s a requirement in System Preferences, or with your Firewall? Like Stealth mode cannot be enabled, or File Sharing must be on or something?
Yes, make sure to disable OSX’s Stealth Mode. would be helpful for that to go in the docs as a note.
If you are prefixing your traces and using the prefix to filter the logcat output, you’re missing out on the actual error messages from the air runtime. Just look what the debug lines are prefixed with by default (in my case “I/air.myapp”) and search for the beginning of that:
adb -d logcat | grep ‘I/air’
or on Windows/DOS:
adb logcat | find “I/air”
(not quite sure what difference the -d flag makes)
This is a good post. Thank you. With just a few tweaks it also applies to the 5.5 release of Flash Professional.
Thanks very much for this, it was really bugging me. For the CS5.5 release the only major difference is that the radio button is now called “Debug” and you have to uncheck the “Launch application on the connected device” so that you have time to start remote debugging. Thanks for the tips though, because this was the last little thing I needed to get my dev environment setup 🙂